Category:Choropleth maps
Jump to navigation
Jump to search

a thematic map in which areas are shaded or patterned in proportion to the measurement of some statistical variable, using geographic boundaries  | |||
| Upload media | |||
 Wikipedia | |||
| Subclass of | map visualization, thematic map | ||
|---|---|---|---|
| |||
 | |||

Subcategories
This category has the following 2 subcategories, out of 2 total.
Media in category "Choropleth maps"
The following 170 files are in this category, out of 170 total.
 100 Mile Footraces in the Contiguous United States, 2011 A.svg 1,150 × 718; 1,018 KB
 100 Mile Footraces in the Contiguous United States, 2011.svg 1,153 × 721; 457 KB
 2019 Economic Freedom of the World.png 6,010 × 2,726; 1.86 MB
 2019 Press Freedom Index seven colours.png 6,019 × 2,759; 1.95 MB
 ADD Destinations.svg 6,964 × 5,992; 1.17 MB
 Africa Visa Openness in 2016.svg 1,000 × 1,000; 186 KB
 African countries by GDP (PPP) per capita in 2017.png 4,800 × 4,795; 1.39 MB
 African countries by HDI (2019).png 4,665 × 4,670; 1.22 MB
 African countries by Human Development Index (2017).png 4,800 × 4,795; 1.32 MB
 AIA Destinations.png 2,753 × 1,400; 92 KB
 AKL Destinations.svg 914 × 403; 1.19 MB
 ALA Destinations.png 2,753 × 1,400; 92 KB
 AMS Destinations.svg 512 × 226; 878 KB
 Asian countries by GDP (PPP) per capita in 2017.png 5,000 × 3,975; 1.73 MB
 Asian countries by Human Development Index (2015).png 5,000 × 4,174; 1.64 MB
 Asian countries by Human Development Index (2017).png 5,000 × 4,320; 1.63 MB
 ATL Destinations.svg 914 × 403; 1.19 MB
 AUH Destinations.svg 914 × 403; 1.48 MB
 Bevölkerungsdichte-Welt.png 1,357 × 628; 34 KB
 CAI Destinations.svg 914 × 403; 1.19 MB
 Carte de France de l'instruction.jpg 1,500 × 1,556; 354 KB
 Carte de France de l'origine des prostituées à Paris.jpg 750 × 576; 215 KB
 Carte de France des crimes contre les propriétés.jpg 1,500 × 1,603; 225 KB
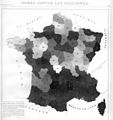 Carte de France des crimes contres les personnes.jpg 1,500 × 1,595; 279 KB
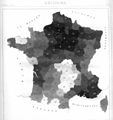 Carte de France des suicides.jpg 1,500 × 1,592; 204 KB
 Carte figurative de l'instruction populaire de la France.jpg 909 × 953; 322 KB
 CDG Destinations.svg 512 × 226; 958 KB
 Ch3e3d.png 725 × 691; 262 KB
 Changes in HDI values from 2018 to 2019 report.png 6,101 × 2,710; 1.87 MB
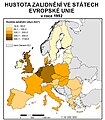 Choropleth map.jpg 700 × 800; 228 KB
 Choropleth-density.png 800 × 600; 458 KB
 Choropleth-density.svg 1,000 × 750; 2.19 MB
 Color progression examples blended hue.PNG 566 × 47; 884 bytes
 Color progression examples full-spectral.PNG 563 × 46; 829 bytes
 Color progression examples partial spectral.PNG 562 × 45; 792 bytes
 Color progression examples single hue.PNG 565 × 48; 900 bytes
 Countries according to the Fragile States Index (2019).png 6,025 × 2,730; 1.85 MB
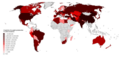 Countries by apple production in 2016.png 6,114 × 2,885; 1.91 MB
 Countries by apricot production in 2016.png 6,103 × 3,018; 2.01 MB
 Countries by artichoke production in 2016.png 6,162 × 2,938; 1.93 MB
 Countries by avocado production in 2016.png 6,158 × 3,047; 1.98 MB
 Countries by barley production in 2016.png 6,460 × 3,377; 2.18 MB
 Countries by cherry production in 2016.png 6,345 × 3,435; 2.25 MB
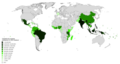 Countries by coconut production in 2016.png 6,256 × 3,356; 1.9 MB
 Countries by Corruption Perceptions Index score (2019).png 6,000 × 2,740; 1.87 MB
 Countries by cucumber production in 2016.png 6,248 × 3,446; 2 MB
 Countries by eggplant production in 2016.png 6,115 × 3,042; 2.06 MB
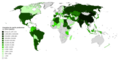 Countries by garlic production in 2016.png 6,152 × 3,167; 2.13 MB
 Countries by GDP (PPP) per capita in 2017.png 6,300 × 3,082; 1.93 MB
 Countries by GDP (PPP) per capita in 2019.png 5,990 × 2,740; 1.54 MB
 Countries by Gender Development Index (2019).png 6,061 × 2,709; 1.49 MB
 Countries by GNI (nominal, Atlas method) per capita in 2016.png 6,300 × 3,408; 2.02 MB
 Countries by GNI (PPP) per capita in 2016.png 6,300 × 3,360; 1.98 MB
 Countries by grape production in 2016.png 6,139 × 3,031; 2.13 MB
 Countries by gross median household income in Int$ (PPP).png 6,300 × 3,340; 2.04 MB
 Countries by gross median per-capita income in Int$ (PPP).png 6,300 × 3,411; 2 MB
 Countries by Human Development Index (2018).png 6,054 × 2,690; 1.47 MB
 Countries by Human Development Index (2018).svg 2,754 × 1,398; 1.06 MB
 Countries by Human Development Index (2019).png 6,060 × 2,737; 1.49 MB
 Countries by inequality-adjusted Human Development Index (2019).png 6,110 × 2,748; 1.79 MB
 Countries by irrigated land area in 2012.png 6,194 × 3,560; 2.13 MB
 Countries by Legatum Prosperity Index (2019).png 6,012 × 2,759; 1.86 MB
 Countries by mean wealth per adult (2019).png 5,928 × 2,730; 1.86 MB
 Countries by mean wealth per adult in 2018.png 6,105 × 3,023; 2.08 MB
 Countries by median wealth per adult.png 5,990 × 2,751; 1.98 MB
 Countries by onion production in 2016.png 6,124 × 2,936; 2.04 MB
 Countries by papaya production in 2016.png 6,150 × 3,197; 2.02 MB
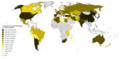 Countries by pear production in 2016.png 6,131 × 3,029; 2.02 MB
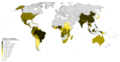 Countries by pineapple production in 2016.png 6,255 × 3,253; 1.9 MB
 Countries by plum and sloe production in 2016.png 6,157 × 2,964; 2.05 MB
 Countries by potato production in 2016.png 6,247 × 3,448; 2.01 MB
 Countries by received FDI.png 6,246 × 3,517; 2.02 MB
 Countries by soybean production in 2016.png 6,325 × 3,414; 2.49 MB
 CVG Destinations.svg 512 × 226; 787 KB
 DasymapBG Bay Area choropleth and dasymetric maps.jpg 231 × 474; 76 KB
 DEL Destinations.svg 940 × 477; 1.27 MB
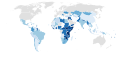 Destination of UK ODA per capita.svg 2,560 × 1,314; 1.05 MB
 Doing business 2017.svg 2,560 × 1,314; 1.05 MB
 Dutch provinces by nominal GRP in 2016.png 4,290 × 4,700; 1.12 MB
 Dutch provinces by nominal GRP per capita in 2016.png 4,290 × 4,700; 1.11 MB
 DXB Destinations.svg 512 × 226; 877 KB
 Essential Air Service Locations (cropped).png 792 × 572; 144 KB
 Essential Air Service Locations.svg 900 × 564; 2.69 MB
 FNJ Destinations.svg 512 × 226; 877 KB
 FRA Destinations.svg 512 × 226; 878 KB
 French departments by legal population (2013).png 6,300 × 6,220; 3.56 MB
 German states by nominal GRP in 2017.png 4,235 × 4,505; 1.27 MB
 German states by nominal GRP per capita in 2016.png 4,191 × 4,501; 1.24 MB
 Global Forest Area-ar.png 792 × 612; 168 KB
 Global Forest Area.svg 792 × 612; 447 KB
 GRU Destinations.svg 914 × 403; 1.19 MB
 HAM Destinations.svg 512 × 226; 877 KB
 Happiness score of countries according to the World Happiness Report (2018).png 6,300 × 3,443; 1.99 MB
 HAV Destinations.svg 914 × 403; 1.19 MB
 HND Destinations.svg 512 × 226; 877 KB
 IAD Destinations.svg 512 × 226; 877 KB
 ICN Destinations.svg 512 × 226; 877 KB
 Indian states and union territories by GRDP (nominal) per capita.png 3,818 × 4,600; 1.19 MB
 Industrial production growth rate (%) in 2017.png 6,300 × 3,520; 2.12 MB
 IST Destinations.svg 512 × 226; 878 KB
 Italian provinces by population (2011).png 5,300 × 6,785; 2.63 MB
 Italian provinces by population density, 2011.png 5,300 × 6,785; 2.57 MB
 JFK Destinations.svg 512 × 226; 886 KB
 JNB Destinations.svg 512 × 226; 957 KB
 Kartogram ciągły.jpg 855 × 840; 64 KB
 Kartogram strukturalny.jpg 606 × 891; 99 KB
 Kartogram złożony1.jpg 1,273 × 802; 219 KB
 Kartogram złożony2.jpg 1,310 × 801; 117 KB
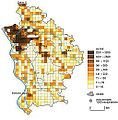 Kartogram-grid.jpg 761 × 777; 102 KB
 KHH Destinations.svg 1,410 × 715; 1.1 MB
 LAS Destinations.svg 512 × 226; 938 KB
 LAX Destinations.svg 512 × 226; 1.19 MB
 Lesistość w Europie.png 406 × 423; 15 KB
 LGW Destinations.svg 512 × 226; 750 KB
 LHR Destinations.svg 512 × 226; 1.19 MB
 MAD Destinations.svg 512 × 226; 1.19 MB
 Malaysian states and federal territories by HDI (2017).png 940 × 314; 89 KB
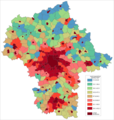 Masovian Voivodship rural density 12-2006.png 1,515 × 1,600; 78 KB
 Mazowieckie density pl.png 1,688 × 1,687; 266 KB
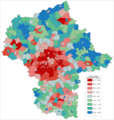 Mazowieckie saldo migracji 2003-2006.png 1,515 × 1,600; 80 KB
 Mercure UE 22 2018 Agence européenne environnement AEE fr.jpg 807 × 659; 115 KB
 Mercury pollution UE 22 2018 by EEA en.jpg 807 × 659; 109 KB
 MEX Destinations.svg 512 × 226; 1.31 MB
 Minimumleeftijd doodstraf vs.JPG 820 × 578; 63 KB
 MUC Destinations.svg 914 × 403; 1.19 MB
 NBO Destinations.svg 512 × 226; 877 KB
 NetRevenue2004Cartogram.png 1,693 × 908; 181 KB
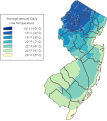 NJ jan low temp.svg 380 × 427; 208 KB
 NJ jul high temp.svg 381 × 425; 243 KB
 ORD Destinations.svg 914 × 403; 1.19 MB
 Polish voivodeships by GRP (PPS) per capita in 2015.png 5,120 × 3,964; 1.11 MB
 Population density by NUTS 3 region (2017).svg 950 × 830; 9.06 MB
 Provinces of Belgium by population (2017).png 4,290 × 3,605; 918 KB
 Provinces of Sweden by population (2016).png 3,900 × 6,690; 1.23 MB
 Reporters Without Borders World Press Freedom Index 2016 (world map).svg 2,560 × 1,314; 1.05 MB
 RMQ Destinations.svg 1,410 × 715; 1.06 MB
 Road density per country.png 1,425 × 625; 40 KB
 SEA Destinations.svg 914 × 403; 1.19 MB
 SFO Destinations.svg 512 × 226; 877 KB
 Shires of Scotland by population (2011).png 940 × 1,226; 353 KB
 Shires of Scotland by population density (2011).png 940 × 1,342; 407 KB
 SIN Destinations.svg 512 × 226; 877 KB
 SlavePopulationUS1860.jpg 10,503 × 8,380; 15.5 MB
 Statistique comparée de l'état de l'instruction et du nombre des crimes.jpg 2,080 × 2,000; 654 KB
 Tamil Nadu Literacy Map 2011.png 1,122 × 1,240; 235 KB
 Tamilnadu Literacy Map 2001.png 2,104 × 1,488; 422 KB
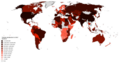 Tomato production in 2017.png 6,189 × 3,284; 1.96 MB
 TPE Destinations.svg 914 × 403; 1.22 MB
 TXL Destinations.svg 914 × 403; 1.19 MB
 ULN Destinations.svg 512 × 226; 877 KB
 United States by Gini Coefficient.png 935 × 722; 193 KB
 United States Murder Rate (2017).svg 512 × 382; 168 KB
 Urban sprawl per country.png 4,211 × 4,824; 2.75 MB
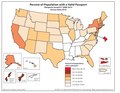 US Passport Holders as Peercent of Population by State.pdf 1,650 × 1,275; 248 KB
 US States by Agreeableness.svg 959 × 593; 29 KB
 US States by Conscientiousness.svg 959 × 593; 29 KB
 US States by Extraversion.svg 959 × 593; 29 KB
 US States by Neuroticism.svg 959 × 593; 29 KB
 US States by Openness to Experience.svg 959 × 593; 29 KB
 Vs choropleet fout.PNG 1,589 × 1,083; 98 KB
 VS inwoners pmi2 met foute visuele rangorde kleur.PNG 1,022 × 652; 43 KB
 VS inwoners pmi2 met foute visuele rangorde zw w.PNG 1,022 × 652; 48 KB
 VS inwoners pmi2 met juiste visuele rangorde zw w choropleet.PNG 1,582 × 995; 91 KB
 VS inwoners pmi2 zonder rangorde is fout leeskaart.PNG 997 × 616; 48 KB
 YYZ Destinations.svg 914 × 403; 1.19 MB
 ZRH Destinations.svg 914 × 403; 1.19 MB


